Best of Data & Data Viz Twitter - Week of December 19, 2022
🎅🧑🎄

Hello everyone,
This is Ying from datadice. Here are this week's most interesting tweets, which include the topics:
Animation Chart
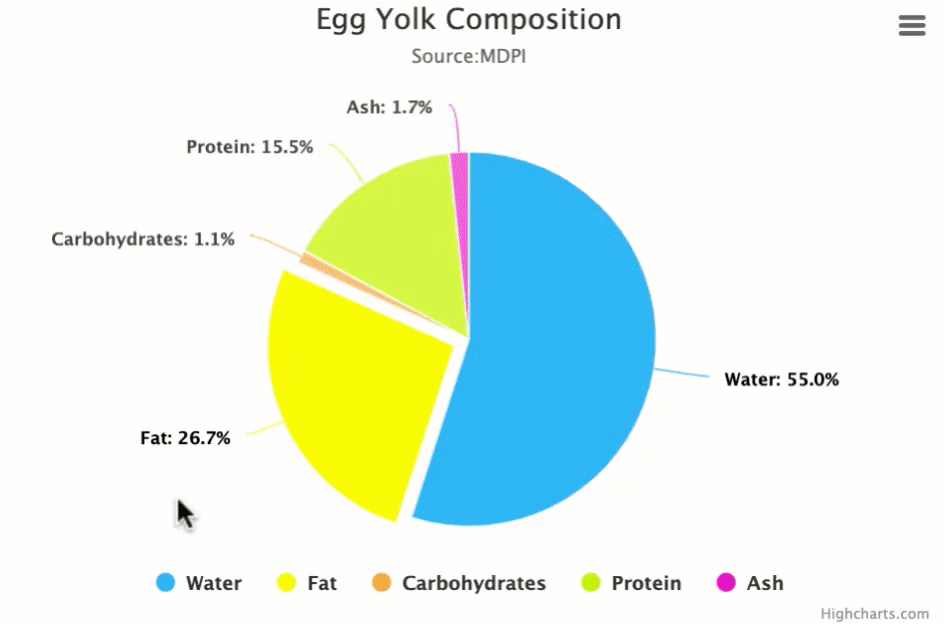
Egg Yolk Composition 🥚
Christianity Is Not A Major Religion In England Anymore
The Relationship Between Wealth And Happiness By Country
A Boxplot Can Hide Information
Average Mail Height
Electro Vehicle Production By Brand
Religion VS. Science
Enjoy your reading and share your thoughts with us!

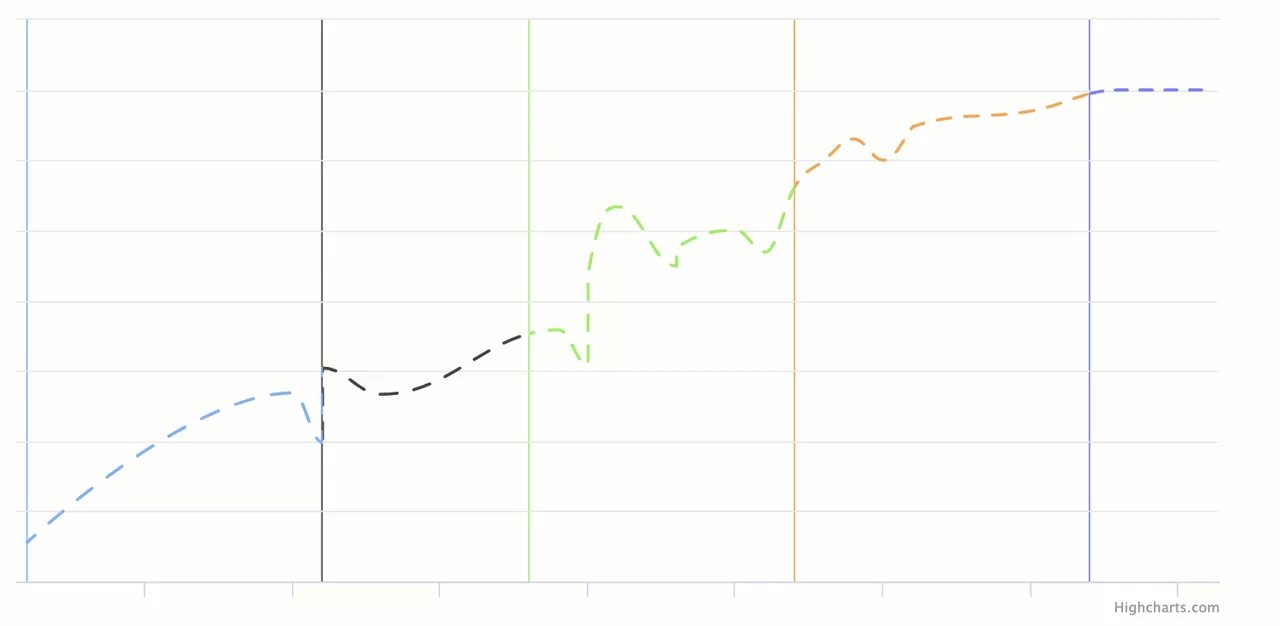
Did you know that you can easily add animation to Highcharts?
By Hubert Kozik
Learn more: highcharts.com/blog/products/…
#dataviz #js #animation
Did you know that a pie chart is excellent for showing composition with categorical data?
By Mustapha Mekhatria
Read more: highcharts.com/blog/chartchoo…
#datascience #continuousdata #categoricaldata #DataAnalytics #chartchooser #js #dataviz #RStats #ChartChooser

Christianity is not a major religion in England anymore says @Census2021 data 🧐
My #MakeoverMonday W51 #dataviz with #AdobeIllustrator breaks down religious structure in England by region
#MMVizReview


The chart shows the relationship between wealth and happiness, by country
X-axis is wealth and the Y-axis is happiness
Blue: Americas
Red: Asia
Grey: Africa
Yellow: Europe
#dataviz


On a related note “vioplot” R package v0.4.0 is released on CRAN. This adds new features, resolves long-standing bugs, and updates the documentation almost entirely by contributions on GitHub. That’s the power of #opensource community.
#rstats #dataviz
cran.r-project.org/package=vioplot

Yan Holtz @R_Graph_Gallery

For my course "R for Bio Data Science" at @DTU_HealthTech, I collect #dataviz how-not-tos and this one is going in the archive! 💻📊📈📉
#dataScience in #Rstats


When it comes to building EVs, some legacy brands have moved quicker than others 🚗
To keep you up to date on this evolving story, we’ve visualized EV production in the U.S. by brand:
visualcapitalist.com/ev-production-…


Thank you for taking the time to read our Newsletter and happy holidays! 🎅