datadice | Best of Twitter

Share this post
Best of Data & Data Viz Twitter - Week of January 02, 2023
datadicebestoftwitter.substack.com

Best of Data & Data Viz Twitter - Week of January 02, 2023

🎆

datadice.bestoftwitter
Jan 9
1
Share this post
Best of Data & Data Viz Twitter - Week of January 02, 2023
datadicebestoftwitter.substack.com

Hello everyone,

This is Ying from datadice. Here are this week's most interesting tweets, which include the topics:

  • Quantity Time Spent on Phone Screen

  • Marathon World Record Holders 🏃‍♀️🏃🏽‍♂️🏃🏻

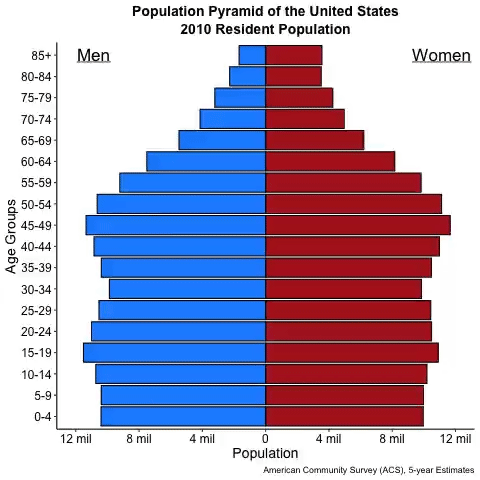
  • How the US resident population has changed from 2010 to 2020

  • Food Price Index Inflation Between 2021& 2022

  • The Great British Bake Off

  • The World's Largest Islands

  • Submarine Cable Network

  • Britain has never invaded 22 Countries

Enjoy your reading and share your thoughts with us!

Twitter avatar for @alenka_gucek
Alenka Gucek @alenka_gucek
07_screen_time#metajournal In July, the #journaldataviz challenge was to quantify time spent on screens, I tracked my phone usage and did @fedfragapane @Domestika course to try to replicate the organic coherence. You be the judge #dataviz. Bujo version in 🧵
digital visualization showing time spend on screens in relation with number of apps visited
8:12 AM ∙ Jan 7, 2023
25Likes2Retweets
Twitter avatar for @Prancke
Martijn van Bloois @Prancke
Bring your own data for #TidyTuesday. I scraped a table from Wikipedia with the marathon world records for men. Code: github.com/mvbloois/tidyt… #Rstats #dataviz
Chart trying to show how much distance previous world record holders on the marathon are behind compared to the current world record.
5:20 PM ∙ Jan 3, 2023
9Likes5Retweets
Twitter avatar for @demography101
Corina McCullough Vidal, M.S. @demography101
For #tidytuesday I decided to use ACS data to see how the US resident population has changed from 2010 to 2020. Looking at the graph, it is very apparent that the US is an aging country. #RStats #RStudio #DataScience #poptwitter #dataviz #gganimate
Image
4:30 PM ∙ Jan 3, 2023
17Likes4Retweets
Twitter avatar for @issa_madjid
Abdoul Madjid @abdoulma@fosstodon.org @issa_madjid
A quick plot for this week #TidyTuesday with own data: Food Price Index Inflation. Data from U.S. Bureau of Labor Statistics. HD graphic and #RStats code: github.com/AbdoulMa/TidyT… Happy new data year to you all. 🥳 #r4ds #tidyverse #dataviz
This plot consists of  several foods inflation between between 2021 and 2022. 
Each food is described by n circles, n representing the number of percent of the food inflation. 
For floating inflation number, the last circle circumference is proportional to the decimal part. 

Data from U.S. Bureau of Labor Statistics.
7:45 PM ∙ Jan 3, 2023
89Likes19Retweets
Twitter avatar for @quite_grey
not quite my grey @quite_grey
A catch up on one of last year's data sets from the bakeoff package, which has a lot of data on The Great British Bake Off. Bakers have learned that chocolate and hot tents don't mix, but citrus fruit and ginger does. #TidyTuesday #RStats #R4DS #gbbo #dataviz
Graphic is titled The Great British Bake Off. It compares how common ingredients were between the original BBC series and the more recent Channel 4 series. Citris fruits, ginger, and fruit and Chelsea buns were more common in recent series. Chocolate was less common.
1:44 PM ∙ Jan 3, 2023
31Likes3Retweets
Twitter avatar for @simongerman600
Simon Kuestenmacher @simongerman600
The world's largest islands visualized. Fun little #dataviz by @stevefaeembra
Image
12:10 PM ∙ Dec 24, 2022
728Likes136Retweets
Twitter avatar for @Julian_H0ffmann
Julian Hoffmann @Julian_H0ffmann
Behind the scenes of the Submarine Cable Network globe. Only the viewport animation within #blender3d. #gischat #dataviz #b3d 1/🧵
1:35 PM ∙ Jan 5, 2023
378Likes80Retweets
Twitter avatar for @TerribleMaps
Terrible Maps @TerribleMaps
All of the countries that have been invaded by Britain
Image
7:23 PM ∙ Jan 8, 2023
82,883Likes7,276Retweets

Thank you for taking the time to read our Newsletter and happy holidays! 🎅


More about datadice:
☛datadice Official Website
☛LinkedIn | datadice GmbH
☛datadice Blog Articles
🎥Youtube:
► Data Warehousing 101 - Starting a new dashboard project
📣More from YouTube Channel:
▪︎ Intro | Datrehousing 101
▪︎ Data Studio Practices
▪︎ BigQuery

Thanks for reading datadice | Best of Twitter! Subscribe for free to receive new posts and support our work.

Share this post
Best of Data & Data Viz Twitter - Week of January 02, 2023
datadicebestoftwitter.substack.com
Comments
TopNew

No posts

Ready for more?

© 2023 datadice.bestoftwitter
Privacy ∙ Terms ∙ Collection notice
Start WritingGet the app
Substack is the home for great writing